|
 |
ISSN 1214-9675 Server vznikl za podpory Grantové agentury ČR. 21. ročník |
|
 |
ISSN 1214-9675 Server vznikl za podpory Grantové agentury ČR. 21. ročník |
|
Témata
Doporučujeme
Kontakt
|

Vydáno dne 02. 06. 2009 (45536 přečtení) |
 |
(1) |
where N is the length of analyzed sequence and M0 is the number of autocorrelation points to be computed. For pitch detection, if we assume that x(n) is periodic sequence, x(n)=x(n+P) for all n, it is shown that the autocorrelation function is also periodic with the same period, R(m)=R(m+P). Conversely, the periodicity in the autocorrelation function indicates periodicity in the signal. For a non-stationary signal, such as speech, the concept of a long-time autocorrelation measurement given by (1) is not really meaningful. In practice, we operate with a short speech segments, consisting of finite number of samples. That is why in autocorrelation based PDAs short-time autocorrelation function, given by
 |
(2) |
is used. The variable m in (2) is called lag or delay, and the pitch is equal to the value of m which results in the maximum R(m). The modified autocorrelation pitch detector MACF [6] differs from the common autocorrelation method by using center-clipping technique in a pre-processing stage. The relation between the input signal x(n), and the center-clipped signal y(n) is
 |
(3) |
where CL is the clipping threshold. Generally, CL is about 50% of the maximum absolute signal value within the signal frame. Non-linear operations on the speech signal such as center-clipping tend to flatten the spectrum of the signal passed to the candidate generator. This results in the increase of the distinctiveness of the true period peaks in the autocorrelation function. Figure 1 presents the example of voiced frame, its center clipped version, and the difference between the autocorrelation function calculated from original signal frame and center-clipped signal frame.
 |
Figure 1: Comparison of autocorrelation function calculated from voiced frame and its center-clipped version.
 |
Figure 2: Block diagram of modified autocorrelation pitch detector.
Figure 2 shows the block diagram of the modified autocorrelation pitch detection algorithm. At the beginning of processing speech signal must be segmented into overlapping frames. Speech recordings with 8kHz sampling frequency were used for experiments. Therefore, input speech signal must be segmented into overlapping frames of 240 samples (30ms), length of overlap is 160 samples (20ms). This method requires low-pass filtering (LPF) up to 800 Hz. Then, the autocorrelation function for the 30-ms section is computed over the range of lags from 16 to 160 samples (i.e. 2ms-20ms period). This range of lags corresponds to the real values of the fundamental frequency of 50-500Hz. Additionally, the autocorrelation function at 0 delay is computed for appropriate normalization purposes. The normalized autocorrelation function is then searched for its maximum peak. The value of the peak and its position are defined. If the value of peak exceeds threshold, the frame is classified as voiced. Otherwise, the section is classified as unvoiced (Fig.3). The value of fundamental frequency can be computed from the pitch period by equalization F0[Hz]=1/T[s].
 |
Figure 3: Process of voiced/unvoiced classification.
In general, the pitch detection described above still exhibits errors as a result of erroneous voiced/unvoiced decisions and inaccurate pitch estimation. Consequently some smoothing stage, such as median filtering is necessary to improve the performance of the system. A major limitation of the auto-correlation function is that it can contain many other peaks, other than those due to basic periodic components (see Fig. 2). For voiced speech signals, the numerous peaks are present in the auto-correlation function due to the damped oscillations of the vocal tract response. It is difficult for any simple peak picking process to discriminate peaks, which doesn’t correspond to the real pitch period, due to periodicity of these extraneous peaks. The peak selection is more robust, if some preprocessing techniques or a relatively large time window are used. However, using of large time window results in improper tracking of rapid changes in pitch. In spite of some peak picking problems, the autocorrelation performs well in the majority of cases and is relatively noise immune [2].
2.2 Normalized Cross Correlation Function (NCCF) Method
The normalized cross correlation function (NCCF) is very similar to the autocorrelation function, but is better follows the rapid changes in pitch and the amplitude of speech signal [3]. The NCCF based PDA overcomes most of the shortcomings of the autocorrelation based algorithms at a slight increase in computational complexity.The NCCF function for speech segment x(n), 0 ≤ n ≤ N-1 is defined
 |
(4) |
where N is the length of analyzed frame, m is a lag and M0 is the number of autocorrelation points to be computed.It should be noted that the values of NCCF function always lie in the interval [-1, 1]. The values of NCCF tends to be close to 1 for lags corresponding to the integer multiples of the true pitch period, regardless of the rapid changes in amplitude of x(n) (Fig. 4). NCCF is better suited for pitch detection than the normal autocorrelation function [6]. It is more frequently used in pitch detection algorithms [2]. In comparison with the normal autocorrelation function, the peaks corresponding to pitch period in the NCCF are more prominent and less affected by the rapid variations in the signal amplitude. The advantage of the NCCF over the autocorrelation method is illustrated in Fig. 4.
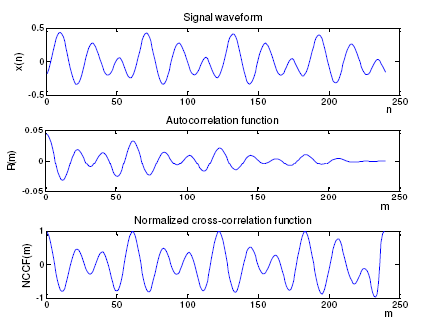 |
Figure 4: Illustration of the autocorrelation and NCCF for a typical voiced speech frame.
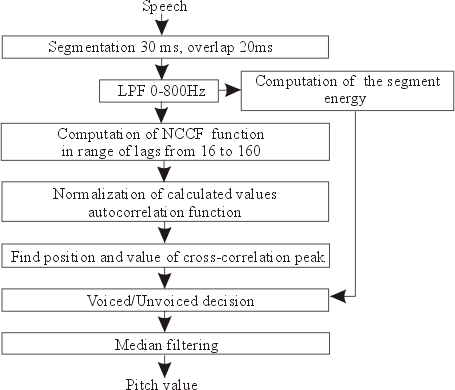 |
Figure 5: Block diagram of NCCF pitch detector.
The block diagram of the NCCF pitch detector is shown in Fig. 5. After segmentation of speech signal into overlapping frames, low-pass filtering is also required. Further normalized cross-correlation function is computed over a range of lags from 16 to 160 samples. The NCCF function is then searched for its maximum value. The value of the peak and its position are defined. Despite of the relative robustness of the NCCF for pitch detection, the magnitude of the NCCF largest peak is not a reliable indicator of whether the speech segment is voiced or unvoiced. A voiced/unvoiced decision is made on the basis of the energy of the frames. If the speech frame is classed as voiced, then the lag corresponding to the highest peak of NCCF is considered to be the pitch period. In order to compensate the effects of some errors in pitch detection and voiced/unvoiced decision median filter is used. The filtering operation produces final F0 estimates.
2.3 Average Magnitude Difference Function (AMDF) Method
The average magnitude difference function (AMDF) [4] is another type of autocorrelation analysis. Instead of correlating the input speech at various delays (where multiplications and summations are formed at each value), a difference signal is formed between the delayed speech and original, and at each delay value the absolute magnitude is taken. For the frame of N samples, the short-term difference function AMDF is defined
 |
(5) |
where x(n) are the samples of analyzed speech frame, x(n-m) are the samples time shifted on m samples and N is the frame length. The difference function is expected to have a strong local minimum if the lag m is equal to or very close to the fundamental period. Figure 6 depicts values of AMDF function for voiced frame.
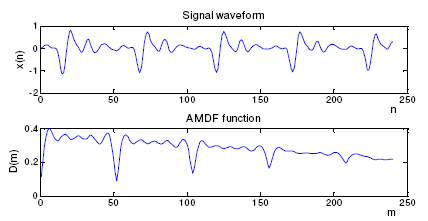 |
Figure 6: ADMF function of voiced frame of speech
PDA based on average magnitude difference function has advantage in relatively low computational cost and simple implementation [2]. Unlike the autocorrelation function, the AMDF calculations require no multiplications. This is a desirable property for real-time applications. Procedure of processing operations for AMDF based pitch detector is quite similar to the NCCF algorithm. After segmentation, the signal is pre-processed to remove the effects of intensity variations and background noise by low-pass filtering. Then the average magnitude difference function is computed on speech segment at lags running from 16 to 160 samples. The pitch period is identified as the value of the lag at which the minimum AMDF occurs. In addition to the pitch estimate, the ratio between the maximum and minimum values of AMDF (MAX/MIN) is obtained. This measurement with the frame energy is used to make a voiced/unvoiced decision [6]. In transition segments between voiced, unvoiced or silence regions some determination errors may occur. Especially F0 doubling or halving errors are most frequent. Therefore median filtering is used in AMDF based PDA.
2.4 Cepstrum Pitch Determination (CPD)
Cepstral analysis also provides a way for the pitch estimation. The cepstrum of voiced speech intervals has strong peak corresponding to the pitch period [5]. Cepstrum pitch determination technique has some advantages over autocorrelation based PDAs. It is assumed that the sequence of voiced speech s(n) can be presented as
|
|
(6) |
where e(n) is source excitation sequence and h(n) is the vocal tract’s discrete impulse response. In the autocorrelation function the effects of the vocal source and vocal tract are convolved with each other. This results in broad peaks and in some cases multiple peaks in the autocorrelation function. In frequency domain convolution relationship between vocal source and vocal tract effects becomes a multiplicative relationship
|
|
(7) |
where S(ω)=F{s(n)}, E(ω)=F{e(n)} and H(ω)=F{h(n)}. Symbol F stands for Discrete Fourier Transform (DFT). Function (7) then can be represented as (8),
|
|
(8) |
The multiplicative relationship between source and tract effects in cepstrum is transformed into an additive relationship. The effects of the vocal source and vocal tract are nearly independent or easily identifiable and separable. It is possible to separate the part of the cepstrum, which is represents source signal and find true pitch period. That is why, in general, cepstrum pitch determination is more accurate than autocorrelation PDAs [2]. For pitch determination, real part of the cepstrum is sufficient. The real cepstrum of the discrete signal s(n) is defined as
 |
(9) |
where S(k) is logarithmic magnitude spectrum of s(n)
 |
(10) |
The cepstrum consists of peak occurring at a high quefrency equal to the pitch period in seconds and low quefrency information corresponding to the formant structure in the log spectrum [5]. To obtain an estimation of the fundamental frequency from the cepstrum we look for a peak in the quefrency region corresponding to typical speech fundamental frequencies. In Figure 7 an example of fundamental frequency estimation from the cepstrum of voiced frame is presented.
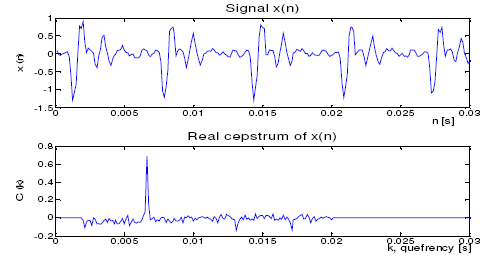 |
Figure 7: Waveform (a) and real cepstrum (b) of voiced speech segment.
Procedure of processing operations for cepstrum based pitch detector is similar to the PDAs described above. It should also be noted that the cepstral pitch detector uses the full-band speech signal for processing. Each block of 240 samples is weighted by a 240-point Hamming window and the cepstrum of that block is computed. The peak cepstral value and its location is determined. If the value of this peak exceeds a fixed threshold, the section is called voiced and the pitch period is the location of the peak. If the peak does not exceed the threshold, a zero-crossing count is made on the block. If the zero-crossing count exceeds a given threshold, the block is marked as unvoiced. Otherwise, it is called voiced and the period is the location of the maximum value of the cepstrum.
3.1 Experiment Settings and Evaluation Criteria
Our experiments evaluate performance of described PDAs. In the experiments we used speech signals from the Czech “SpeechDat” database of telephone speech. Speech recordings from the database consist of numbers from 1 to 10 in Czech language pronounced by 5 males and 5 females. The sampling rate for the speech signals was 8kHz using 16-bit A/D converter. Speech recordings were hand-marked into voiced/unvoiced regions and individual pitch values.
The accuracy of the different pitch detection algorithms was measured according to the following criteria [8]:
1. Classification Error (CE): it is the percentage of unvoiced frames classified as voiced and voiced frames classified as unvoiced.
2. Gross Error (GE): percentage of voiced frames with an estimated fundamental frequency value that deviates from the reference value more than 20%.
3.2 Results of PDAs Performance Evaluation
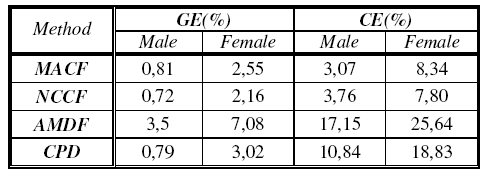
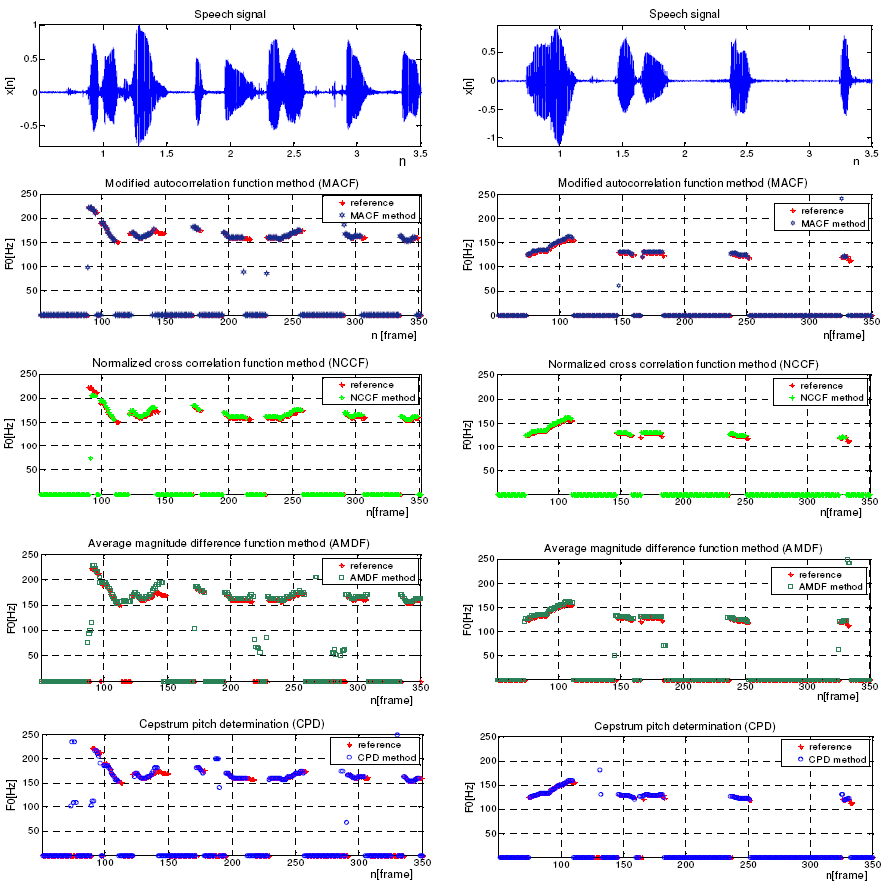
In order to observe performance of four described PDAs utterances pronounced by male and female speakers were selected from SpeechDat database. Each utterance consists of ten words (numbers from one to ten) in Czech language. Results of PDA performance evaluation are shown in Table 1 and Fig. 8. Results of evaluation of pitch detection algorithms are presented separately for male and female speech. In Fig. 8 graphical representation of PDAs performance is presented. For better view, Fig. 8 presents only part of the utterances used in experiments. It should be noted that pitch detection algorithms performed better on utterances pronounced by male speakers. As follows from Table 1, the best results among the algorithms were achieved by algorithm based on normalized cross-correlation function (NCCF). For male speech only 0.72% of voiced frames have the estimated F0 value more than 20% deviation from the reference. NCCF is the best in the overall gross errors although it is closely followed by MACF (GE=0.81). In addition, MACF algorithm outperforms NCCF in voiced/unvoiced classification for male speech. For MACF only 3.07% of voiced frames were misclassified as unvoiced and unvoiced frames misclassified as voiced. The CPD algorithm gets the good results in pitch estimation for male a female speech (GE=0.79 and 3.02 respectively). However it fails MACF and NCCF algorithms in voiced/unvoiced classification (CE=10.84 and 18.83 for male and female speech respectively). Results of our experiments show that AMDF method is the most inaccurate one. It has the biggest values of gross error and classification error parameters. Problem of pitch multiple and pitch halving is evident for this pitch detection algorithm.
Table 1. Performance evaluation results of different PDAs on clean speech
 |
 |
a) b)
Figure 8: Evaluation of pitch detection algorithms on male (a) and female (b) speech.
This paper is focused on pitch detection algorithms for speech signals. Four PDAs based on the autocorrelation function, the normalized cross-correlation function, the average magnitude difference function and cepstral analysis were introduced. Each of the described algorithms have their advantages and drawbacks. From the experimental results, the MACF method is more convenient for common usage. This algorithm exhibits accurate results of pitch estimation and low computational complexity. The NCCF method presents the best results in pitch detection accuracy and voiced/unvoiced classification, but it is computationally more complex than the MACF. In addition, it needs energy calculations for voiced/unvoiced classification. The CPD show good pitch estimation accuracy. Fundamental frequency estimation in this algorithm is immune to errors due to effects of vocal tract. However, CPD method is computationally complex; it needs additional parameters for voiced/unvoiced decision. The AMDF method has great advantage in very low computational complexity, it possible to implement it in real-time applications. However this algorithm showed poor results in accuracy of pitch estimation and pattern recognition.
This paper has originated thanks to the support from the Ministry of Education, Youth and Sports of Czech Republic within the project MSM6840770014.
References
[1] A. M. Kondoz , "Digital speech: Coding
for low bit rate communication systems", 2nd Edn, John Wiley&Sons, England,
2004.
[2] W. J. Hess, Pitch Determination of Speech Signals. New York: Springer, 1993.
[3] D. Talkin, “A robust algorithm for pitch tracking (RAPT)”.Speech Coding and
Synthesis, Elsevier Science, Amsterdam, pp.495-518,1995.
[4] M. J. Ross, H. L. Shaffer, A. Cohen, R. Freudberg, and H. J. Manley,
“Average magnitude difference function pitch extractor,” vol.ASSP-22, no. 5, pp.
353–362, Oct. 1974.
[5] A. M. Noll, "Cepstrum Pitch Determination", Journal of the Acoustical
Society of America, Vol. 41, No. 2, pp. 293-309, 1967
[6] L. Rabiner, M. J. Cheng, A. E. Rosenberg, and C. A. McGonegal, "A
comparative performance study of several pitch detection algorithms," IEEE
Transactions on ASSP, vol. 24, pp. 399-417, 1976.
[7] H. Bořil, P. Pollák, "Direct Time Domain Fundamental Frequency Estimation of
Speech in Noisy Conditions". Proc. EUSIPCO2004, Wien, Austria, vol. 1,
p. 1003-1006, 2004.
[8] B. Kotnik, H. Höge, and Z. Kacic, “Evaluation of Pitch Detection Algorithms
in Adverse Conditions”. Proc. 3rd International Conference on Speech Prosody,
Dresden, Germany,pp. 149-152, 2006.
Tento web site byl vytvořen prostřednictvím phpRS - redakčního systému napsaného v PHP jazyce.
Na této stránce použité názvy programových produktů, firem apod. mohou být ochrannými známkami
nebo registrovanými ochrannými známkami příslušných vlastníků.