Optimisation Target Base Station Selection Based on Fuzzy Logic
Autor: E. Kozlowska <kozloe1(at)fel.cvut.cz>, Pracoviště: České vysoké učení technické v Praze, FEL, Téma: Mobilní sítě, Vydáno dne: 12. 08. 20121. Handoff Fuzzy System
The main idea of presented handoff scheme is based on the fuzzy logic. The schemes consider not only distance from the target base station, but also the bandwidth usage (data transmission rate) and mobile station velocity. Here, fuzzy logic is used to reach a decision about the target BS to be chosen by handoff controller, such that the handoff is performed as fast as possible with reasonable QoS levels. It will allow to anticipate or to delay the handoff taking real situation into account based on specified variables.
The system can consist of multiple fuzzy controllers ([1], [2]). Each controller will process all given input data to receive one output result. The entry data is composed of: the distance from target BS (based on positioning system data or signal strength), bandwidth usage in target BS cell and Mobile Station (MS) velocity, as presented in Figure 1. Handoff fuzzy output (HFO) value is calculated for each candidate target base station. The BS with the highest HFO value is the best candidate.
The main task of handoff controller is to determine whether, based on available variables, handoff should be recommended or not. More than one controller will allow to adapt better to real situations. For example, if for some reason connection to initially chosen BS is not possible, the system will try to connect to next candidate with the highest HFO value.
 |
|
Figure 1. Handoff controller scheme |
2. Case of Study
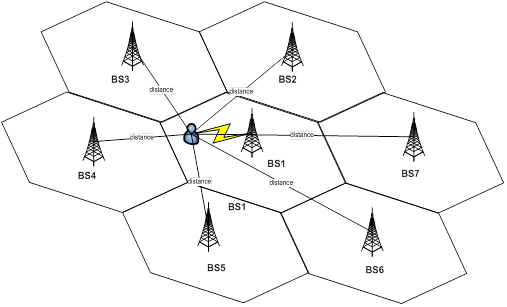
Fuzzy logic processing described below is based on example cell environment (shown in Figure 2) consisting of seven hexagon cells with twenty kilometres radius. A base station is placed in the middle of each cell. The maximum velocity of MS is fifty metres per second and available data rate amounts to two hundred megabits per second. By changing parameters maximum values, this model can be applied to almost all present wireless networks. Borders of each cell are overlapping to allow soft handover execution. MS is connected to BS1 and monitors signal from BS2, BS3, BS4 and BS5.
 |
|
Figure 2. Example environment |
In Table 1 a specific situation is presented, where distance from each adjacent BS is known along with bandwidth occupancy in given cell. Each cell represents different network conditions – usage of bandwidth. Assumption is made that the mobile station moves with forty metres per second velocity. The BS7 and BS6 are not taken into consideration as the distance to MS is too big.
Table 1. User position and network conditions
| BS2 | BS3 | BS4 | BS5 | |
| Distance | 30 km | 21 km | 19 km | 28 km |
| Bandwidth usage | 120 Mbps | 100 Mbps | 180 Mbps | 80 Mbps |
3. Handoff Rule Matrix
Handoff fuzzy decision will depend on a rule matrix created based on the known sensitivity of input values. Below Table 2 is representation of “IF”, “AND” and “THEN” equation for every possible input combination.
For example, if a MS is close to the target BS and the target BS low usage of bandwidth and it moves with high speed then the HFO is YES. These rules are created for each possible situation considering the inputs chosen.
Table 2. Rules for fuzzy handover
| Rule No. | Distance | MS Velocity | Used bandwidth | HFO output |
| 1 | Close | High | Medium | Yes |
| 2 | Close | High | Low | Yes |
| 3 | Close | Average | Medium | Yes |
| 4 | Close | Average | Low | Yes |
| 5 | Medium | High | Medium | Yes |
| 6 | Medium | High | Low | Yes |
| 7 | Close | Low | High | Be ready |
| 8 | Close | Low | Medium | Be ready |
| 9 | Close | Low | Low | Be ready |
| 10 | Close | Average | High | Be ready |
| 11 | Close | High | High | Be ready |
| 12 | Medium | High | High | Be ready |
| 13 | Medium | Average | High | Be ready |
| 14 | Medium | Average | Medium | Be ready |
| 15 | Medium | Average | Low | Be ready |
| 16 | Medium | Low | High | Wait |
| 17 | Medium | Low | Medium | Wait |
| 18 | Medium | Low | Low | Wait |
| 19 | Far | High | High | Wait |
| 20 | Far | High | Medium | Wait |
| 21 | Far | High | Low | Wait |
| 22 | Far | Average | High | No |
| 23 | Far | Average | Medium | No |
| 24 | Far | Average | Low | No |
| 25 | Far | Low | High | No |
| 26 | Far | Low | Medium | No |
| 27 | Far | Low | Low | No |
Output values were assigned based on logical reasoning.
The low speed does not influence handoff decision in significant way, as it leaves time for decision making. Slow MS (zero to twenty metres per second – walking person speed) should be ready for handover if it is close to target BS (ten to twenty kilometres), with medium distance (fourteen to twenty four kilometres) it should wait, if the distance decreases and when it is far away (twenty to thirty kilometres) it should not proceed with any action. For slow moving MS bandwidth usage will not influence the handover decision,
Average speed of MS (fifteen to thirty five metres per second – bike or slowly moving car) will lead to quicker, but not drastic distance changes from target BS. If the MS is far away from target BS, decision about handover is not needed. With medium distance the MS should be ready for potential handover, and with close distance it should execute handover, as it will cross cell boundary in nearest future. If MS is close to target BS and the bandwidth usage is medium or low, the handover should be executed, but with high bandwidth usage, it should not proceed right away, as the network condition could influence quality of used service. MS still have time to wait if by the way another BS occurs that might offer better service level.
When MS is moving fast (twenty five to 50 metres per second – car or train), time for decision is limited. If it is in close or medium distance from BS and the bandwidth usage is medium or low, MS should proceed with the handover, as the conditions are ideal. If the bandwidth is high, MS should be ready for handover if no other option appears in the nearest future. Far distance from BS still leaves time to find better target BS, so for any bandwidth condition, MS should wait with handover execution.
4. Handoff Fuzzification Mechanism
This phase of fuzzy logic procession is to deliver input parameters of MS velocity, distance from the target base station and bandwidth usage in the candidate cell. Following parameters are fuzzified with use of pre-defined input membership functions (see Chapter 2.). Sinusoidal membership functions were chosen for simulation purposes made in simulating program. Smoother membership functions give smoother output curve. Other shapes (triangular often chosen because of its mathematical simplicity) can also be chosen, if their representation of real scenario in the wireless network is more suitable.
Abbreviations for fuzzy sets used in membership functions are listed in below.
Table 3. Abbreviations for fuzzy sets used in membership functions
| Distance | MS Velocity | Bandwidth used |
| C- close | L – low | LB – low bandwidth use |
| M - medium | A – average | MB – medium bandwidth use |
| F - far | H – high | HB – high bandwidth use |
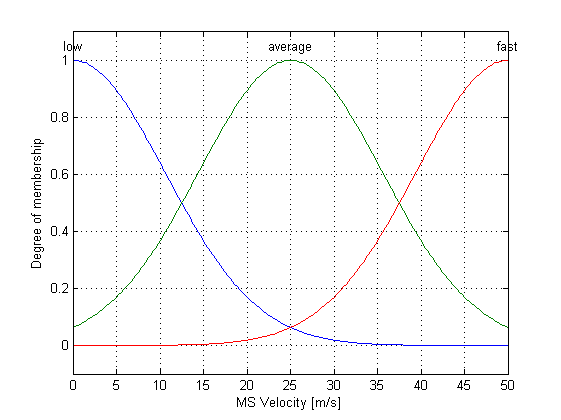
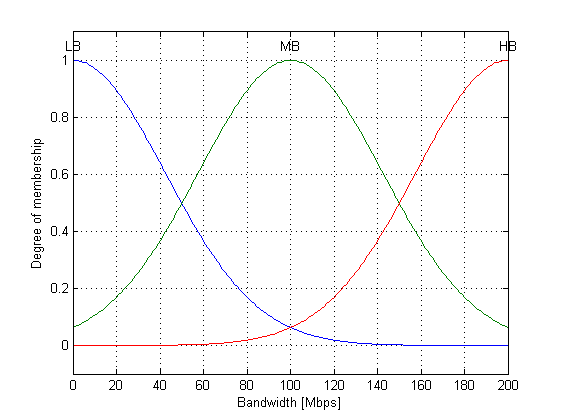
Figures below show input membership graphs for three chosen variables, which are graphical representations of the participation magnitude per each input. Distance from target BS is shown in Figure 3 with close curve in range from ten to twenty kilometres, medium curve from ten to thirty kilometres and far curve with values from twenty to thirty kilometres. Figure 4 presents MS velocity, where low curve is in range of zero to 25 metres per second, average curve from zero to fifty and fast curve from twenty five to fifty metres per second. Used bandwidth is shown Figure 5, with low bandwidth usage from zero to one hundred megabits per second, medium bandwidth usage from zero to two hundred forty, and high bandwidth usage from one hundred to two hundred megabits per second.
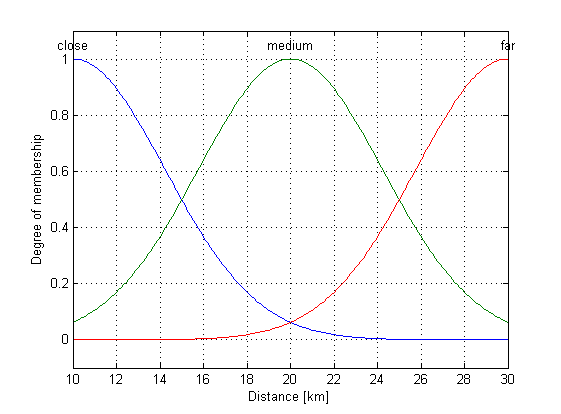 |
Figure 3. Input membership function of distance from a BS |
 |
|
Figure 4. Input membership function of MS velocity |
 |
|
Figure 5. Input membership function of bandwidth used |
The first step of the fuzzy logic method is to transform the input numerical value to names of member function and values of memberships in the function.
For instance, given distance from BS3 = 19, the following value can be read off the graph from Figure 3 for function “Far” and “Medium”. “Close” curve has zero value in this point.
Input (Membership-FN, Membership-Degree)
Distance from BS3 =19 (C, 0.11) (M, 0.97) (F, 0.03),
where, C stands for close distance, M for medium and F for far distance.
Similar results can be read off from the rest of membership function graphs. For example, if MS velocity equals forty and used bandwidth equals one hundred and eighty megabits per second, the following values in Table 4 can be read from the charts:
Table 4. Analysed example for BS3
| Input | (Function Name, Degree) | (Function Name, Degree) | (Function Name, Degree) |
| Distance from BS3 = 19 | (C, 0.11) | (M, 0.97) | (F, 0.03) |
| MS velocity = 40 | (A, 0.19) | (H, 0.48) | |
| Used bandwidth = 180 | (MB, 0.06) | (HB, 0.83) |
Above example will be used for all calculations described below.
5. Handoff Fuzzy Output Calculation
The simulation is based on Sugeno reasoning method, described in [1], as it works well with optimisation and adaptive techniques.
Firing strength αi of the AND rules is calculated as minimum value of all input values for given rule. For instance, if distance from BS3 equals nineteen kilometres, MS velocity equals forty metres per second and used bandwidth one hundred and eighty megabits per second, rule 1 is applied, which is (C, H, MB), then αi is minimum value of (0.11, 0.48, 0.06). In result αi equals 0.06.
In Table 5 αi values (firing level) for each rule of analysed example are calculated. Third column shows rule matrix result for the input combination, and fourth column shows minimum value a of all three input values.
Table 5. Firing strength of rules
| Rule No. | Rule description | HFO output | Firing strength of rule |
| 1 | C, H, MB | Yes | min(0.11;0.48;0.06) = 0.06 |
| 2 | C, H, LB | Yes | 0 |
| 3 | C, A, MB | Yes | min(0.11;0.19;0.06) = 0.06 |
| 4 | C, A, LB | Yes | 0 |
| 5 | M, H, MB | Yes | min(0.97;0.48;0.06) = 0.06 |
| 6 | M, H, LB | Yes | 0 |
| 7 | C, L, HB | Be ready | 0 |
| 8 | C, L, MB | Be ready | 0 |
| 9 | C, L, LB | Be ready | 0 |
| 10 | M, H, HB | Be ready | min(0.97;0.48;0.83) = 0.48 |
| 11 | C, A, HB | Be ready | min(0.11;0.19;0.83) = 0.11 |
| 12 | C, H, HB | Be ready | min(0.11;0.48;0.83) = 0.11 |
| 13 | M, A, HB | Be ready | min(0.97;0.19;0.83) = 0.19 |
| 14 | M, A, MB | Be ready | min(0.97;0.19;0.06) = 0.06 |
| 15 | M, A, LB | Be ready | 0 |
| 16 | M, L, HB | Wait | 0 |
| 17 | M, L, MB | Wait | 0 |
| 18 | M, L, LB | Wait | 0 |
| 19 | F, H, HB | Wait | min(0.03;0.48;0.83) = 0.03 |
| 20 | F, H, MB | Wait | min(0.03;0.48;0.06) = 0.03 |
| 21 | F, H, LB | Wait | 0 |
| 22 | F, A, HB | No | min(0.03;0.19;0.83) = 0.03 |
| 23 | F, A, MB | No | min(0.03;0.19;0.06) = 0.03 |
| 24 | F, A, LB | No | 0 |
| 25 | F, L, HB | No | 0 |
| 26 | F, L, MB | No | 0 |
| 27 | F, L, LB | No | 0 |
Chosen situation provided value only for twelve rules. For the rest of curves read out values equals zero.
Consequence of Sugeno method is sought after defuzzified crisped. For needs of a given analyse it was decided that singleton output function are completely sufficient, as it will simplify mathematical computation. Chosen constant values z were assigned to individual rule outputs: Yes, Be ready, Wait and No, as shown in Table 6. With use of simulation programs more complex methods can be applied, for example output function can have linear character.
Table 6. Rules outputs constants
| Yes | 1 |
| Be ready | 0.6667 |
| Wait | 0.33333 |
| No | 0 |
These values should correspond to different physical situation. With high value assigned to specific output, there is a bigger probability that the handoff would be recommended even if the rule output value is No. Values in Table 6 represents the most common situation, where constant values correspond with rule outputs. In range from zero to one, No has the lowest value, Yes the highest possible value, while Be ready and Wait has proportional values from this range.
Based on the (10) in [1] equation the crisp control action is calculated as
 |
(1) |
Chosen method assigns values to HFO ranging from zero to one, where the following applies: higher value, stronger recommendation for handoff.
6. Analyse of Fuzzy Handover Mechanism
Based on the input values provided in Chapter 2. for each probable target base station, the crisp value of fuzzy logic decision is computed. In result, the BS with highest value of decision is recommended as a target BS. As mentioned in [1], for fuzzy logic processing several methods of inference and defuzzification can be applied. Simulating program allows to use Mamdani and Sugeno inference mechanism, which gives slightly different results, as it can be noticed in Table 7. Mamdani method is incorporated with centroid defuzzification method, as it is the most accurate defuzzification mechanism for this method.
Table 7. Comparison of HFO results for adjacent BSs
| BS2 | BS3 | BS4 | BS5 | |
| Sugeno | 0.249 | 0.808 | 0.687 | 0.317 |
| Mamdani | 0.342 | 0.67 | 0.652 | 0.393 |
Calculation results for HFO recommendation show that for chosen scenario both Sugeno and Mamdani method shows that the best target base station in given moment is BS3.
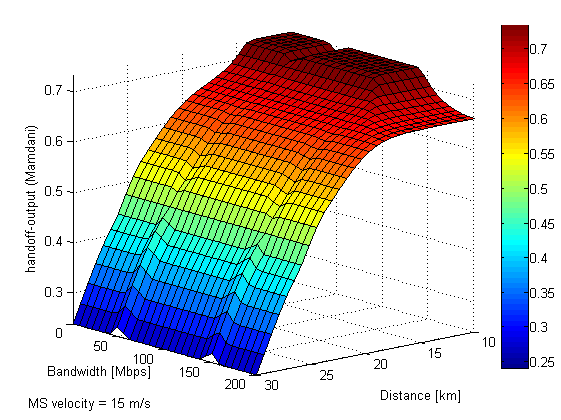
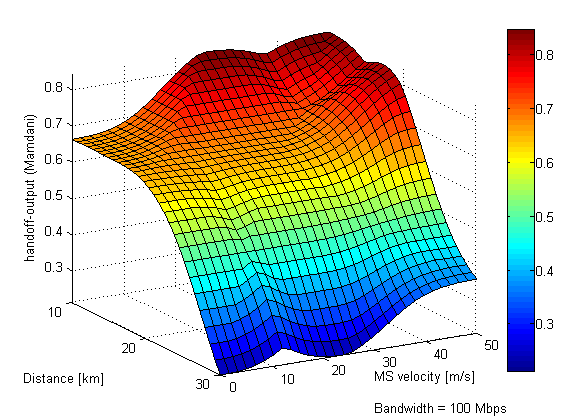
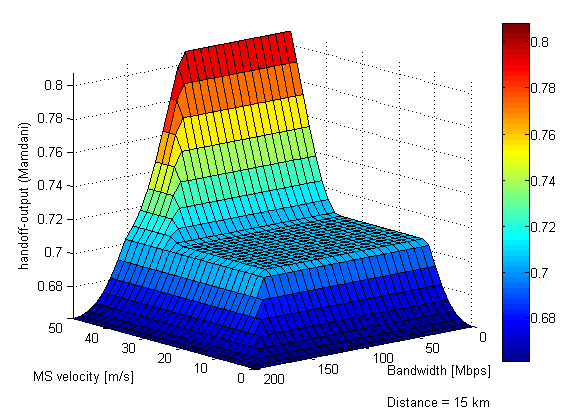
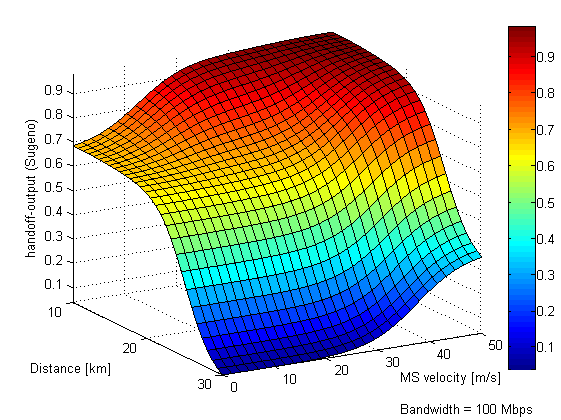
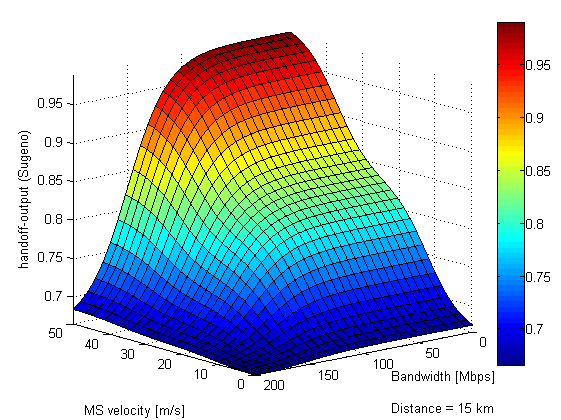
Below figures present simulation results for a different inference method and defuzzification method. It is not possible to show in one simulation result how changes of each parameter affect handoff decision output, as it is three dimensional graph. For that reason, figures present dependency of handover recommendation for two parameters on axis X and Z with third parameter having an average values and being a constant.
First method.
Mamdani inference mechanism and centroid defuzzification method.
 |
|
Figure 6. Mamdani - Handover dependence on distance and bandwidth |
 |
|
Figure 7. Mamdani - Handover dependence on distance and MS velocity |
 |
|
Figure 8. Mamdani - Handover dependence on MS velocity and bandwidth |
The Figure 6 illustrates the three-dimensional surface curve between bandwidth usage, distance and handover recommendation for constant velocity 15 m/s. Figure 7 shows how handover recommendation changes depending on distance and velocity with constant bandwidth of 100 Mbps. Figure 8 shows surface curve between MS velocity, bandwidth and handoff recommendation at fix value of distance being 15 kilometres.
Second method.
Sugano inference mechanism.
 |
|
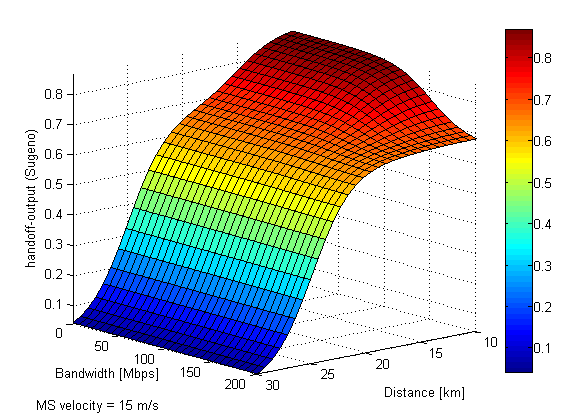
Figure 9. Sugeno - Handover dependence on distance and bandwidth |
 |
|
Figure 10. Sugeno - Handover dependence on distance and MS velocity |
 |
|
Figure 11. Sugeno - Handover dependence on MS velocity and bandwidth |
Similarly, Figure 9, Figure 10, Figure 11 display surface curves between bandwidth usage, distance and MS velocity and handoff recommendation.
These graphs show how handoff factor increases as distance of MS from target BS decreases. It is also clear that if MS velocity increases the handoff factor also increases accordingly.
7. Comparison of Multiple Parameters
Model with Single Parameter Model to show the advantage of multiple parameters deciding method, in below Table 9 results from Chapter 6. are compared with results of calculation covering only one input data: distance from target BS. Membership function for distance from target BS is the same as for the multiple parameter model (Chapter 4.), but the rules are as follow (Table 8):
Table 8. Rule matrix for single parameter model
| Rule No. | Distance | HFO output |
| 1 | Close | Yes |
| 2 | Medium | Wait |
| 3 | Far | No |
If MS is close to target BS, the handover should be done. If it is in medium distance, it should wait and if it is far away it should not take any action.
Table 9. Comparison of single input model and multiple input model
| BS2 | BS3 | BS4 | BS5 | |
| Sugeno | 0.249 | 0.808 | 0.687 | 0.317 |
| Mamdani | 0.342 | 0.67 | 0.652 | 0.393 |
| Single input Sugeno | 0.0294 | 0.468 | 0.532 | 0.0797 |
| Single input Mamdani | 0.151 | 0.47 | 0.53 | 0.214 |
As it can be read from Table 9, according to single input method, the best target BS is BS4, as MS is closest to this BS.
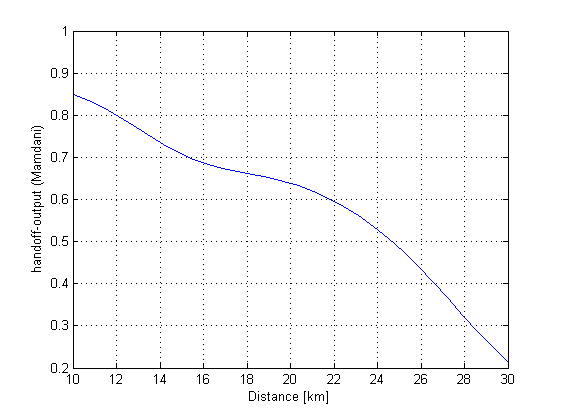
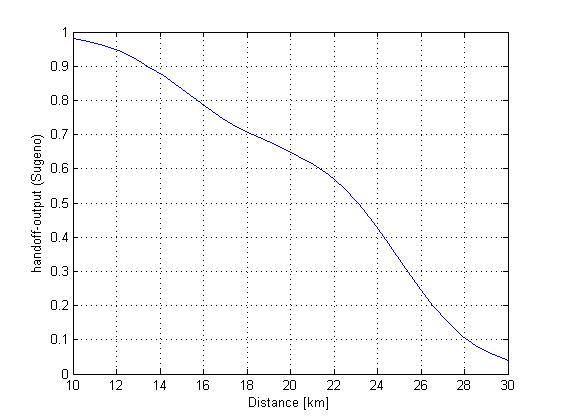
Figure 12 and Figure 13 shows how handover recommendation is influenced only by the distance from the target BS depending on chosen inference mechanism.
 |
|
Figure 12. Mamdani - Handover dependence on distance |
 |
|
Figure 13. Sugeno - Handover dependence on distance |
8. Conclusion on Optimising Target Base Station Selection
Based on presented simulation results (Table 7) a conclusion can be made that the choice of inference method and defuzzification method has only minor influence on the final result. Sugeno method provide smoother curve of handoff output, which better corresponds to real situation. This conclusion follows from the graphs differences presented in Chapter 6. for both methods, and corresponds with appropriateness of Sugeno mathematical approach for simulation purposes as it was mentioned in [29]. Mathematical algorithm principles of both methods, including the final defuzzification method are described in [1].
Today’s applied handover algorithms are based only on one input value, such as RSS (Received Signal Strength), SIR (Signal-to-Interference Ratio) or distance, which does not provide proper information for handover decision making. If, like in presented analysed example (Chapter 2.), handover initiation would be made based only on distance from target BS, the unquestionable target BS would be BS4, as the MS is closest to it (Table 9). Nevertheless, it is not marked as the best according to multiple parameters fuzzy logic system because of its bandwidth high load.
It is clear, that handover mechanism based on fuzzy logic system that evaluates multiple input parameters, gives much more precise result (Table 7) for handover recommendation than today’s systems based on thresholds and hysteresis.
Naturally, for decision making and handover initiation is it possible to use more input parameters, than just the three calculated in the modelled example (Chapter 2).
Benefit of using multiple input parameters is possibility to optimise handover not only based on network requirements, but also based on end user requirements. In this way, the network provider will be able to offer new category of services to his clients. In wireless network, additional relevant parameters, such as desired transmission rate, latency, etc. can be considered when making decision making about handover execution.
References
[1] Kozlowska E.: Basic Principles of Fuzzy Logic. Access server [online].
2012, 10. [cit. 2012-08-12]. ISSN 1214-9675. Available at:
http://access.fel.cvut.cz/view.php?cisloclanku=2012080002
[2] Kaehler S.D.,: Fuzzy Logic Tutorial. Seattle Robotics Society [online].
1998. ed. [cit. 2012-08-22]. Avaible at:
http://www.seattlerobotics.org/encoder/mar98/fuz/flindex.html
[3] Fullér R.,: Neural fuzzy systems: towards IMT-advanced networks. Åbo: Åbo
akademi, 1996, xxvii, 275 p. ISBN 95-165-0624-0.
[4] Stojmenovic I.: Handbook of wireless networks and mobile computing. New
York: Wiley, 2002, xxix, 630 p. ISBN 04-714-1902-8.